
Home / Journal / Endocrinology, Diabetes and Obesity
Effect of GH Treatment on Coagulation Parameters in Children with Growth Hormone Deficiency
coagulation fibrinolysis growth hormone deficiency growth hormone therapy
Fotini-Helen Karachaliou, Helen Pergantou, Athina Dettoraki, Evangelia Boudouvi, Maria Kafetzi, Aspasia Fotinou, Vassiliki Papaevangelou, Helen Platokouki
DOI: https://doi.org/10.31532/EndocrinolDiabetesObes.1.1.004 22 Jun 2018
Download

Abstract
Objectives: To investigate the effect of GH administration on coagulation/fibrinolysis in GHD children before and after GH replacement.
Methods: Fifteen prepubertal children, (mean age±SE: 9.8±0.4 years) with growth hormone deficiency (GHD) were included in this hospital based prospective study. Serum levels of PT, APTT, fibrinogen, VII, VIII, antithrombin (AT), protein C (PC), D-dimers, plasminogen (Plg), PAI-1 and a2antiplasmin (a2P) were measured before and after rhGH treatment. Control values were obtained from thirteen healthy subjects matched by age, sex and BMI.
Results: At baseline all studied parameters were within normal ranges. However, PT and AT levels were significantly lower [(12.1±0.1 vs 12.5±0.04sec, p =0.04) and (117.3±3.1 vs 128.7±3.2%, p=0.024) respectively], and VIII, PAI-1 and a2P levels significantly higher compared to healthy controls [(122.6±6.1 vs 82.6±6.1%, p=0.001), (2.9±0.1 vs 1.3±0.3U/ml, p=0.001) and (119.1±1.0 vs 105.2±2.0%, p=0.001) respectively]. After a mean (SE) interval of 9.3 (0.4) months of treatment, a significant increase in PT and AT values was noted [(12.5±0.23 vs 12.1±0.15sec, p=0.034) and (123.2±2.6 vs 117.3±3.1%, p=0.052) respectively]. PAI-1 levels were significantly decreased (2.3±0.3 vs 2.9±0.1U/ml, p=0.001)
Conclusions: GH replacement therapy led to a significant increase in PT and AT levels and significant decrease in PAI-1 levels in GHD children, suggesting a beneficial effect of GH treatment against the possible risk of future atherothrombosis.
Keywords
Coagulation, fibrinolysis, growth hormone deficiency, growth hormone therapy
Introduction
Adults with growth hormone deficiency (GHD) not receiving GH replacement therapy are at an increased relative risk of cardiovascular and cerebrovascular disease and mortality.1–4 This is due to the clustering of surrogate markers of vascular risk such as increased truncal fat mass and dyslipidemia5,6, impaired insulin sensitivity and increased frequency of impaired glucose tolerance 7, impaired endothelial function 8, impaired cardiac function9,10 and decreased fibrinolytic activity with a mild prothrombotic state suggested by a small number of studies.11–16 Elhadd et al.11 reported increased circulating levels of von Willebrand factor (vWF), thrombomodulin, and some endothelial adhesion molecules (intercellular adhesion molecule-1 and E-selectin) in GH-deficient adults. Increased plasma levels of plasminogen activator inhibitor type1 (PAI-1) and fibrinogen have been reported in other studies. 12–14 GH replacement therapy has been shown to reverse high fibrinogen and PAI -1 levels to normal14,15, decrease intercellular adhesion molecule-1, and E-selectin levels14 and produce an increase in prothrombin time (PT) and activated partial thromboplastin time (APTT) levels.16
Data on children and adolescents with GH deficiency are even more scarce. A state of hypercoagulability suggested by elevated fibrinogen levels and decreased fibrinolytic capacity indicated by high PAI-1 levels has been also reported in children17 and adolescents.18,19
The aim of the study was to evaluate the disorders in coagulation – fibrinolysis system of prepubertal children with GH deficiency and the possible impact of GH replacement therapy on them.
Material and Methods
This was a hospital based prospective study. Fifteen children (10 girls, 5 boys) diagnosed with GHD at a mean (SE) age of 9.8 (0.4) yrs were included in the study. Thirteen healthy children matched for age and sex served as controls. They were all prepubertal children (Tanner stage 1) with body mass index (BMI) within normal ranges.
Diagnosis of GHD was based on the following criteria short stature -2 S.D. from the reference population, growth rate, at least during the last year, 1 S.D. below the mean of the chronological age, bone age, at least <1 year of the chronological age. Two GH provocation tests were applied, with glucagon induced post-hyperglycemic hypoglycemia and clonidine with a maximum GH peak of ≤7 ng/ml measured by means of chemiluminescent immunoassay (CLIA) technology (Liaison, Diasorin S.p.A). All girls underwent karyotyping and showed 46 XX. All children received rhGH at a dose ranging 0.15-0.2mg/kg/week, administered daily at bedtime 9.30 to 10.30pm. None of the children were taking any other medication. Exclusion criteria included children born small for gestational age and obese children in order to exclude possible influences of insulin levels in measured parameters. For the same reason, all children were prepubertal (Tanner stage I). A group of 13 healthy children (8 girls and 5 boys) matched for age and sex served as controls.
All children were evaluated by means of height, weight, pubertal stage and blood pressure (BP). A blood sample was taken after overnight fast at 8.00 to 8.30 am and measurements of glucose, cholesterol (Chol), triglyceride (TG) and IGF-1 levels were performed in all children. IGF-I was measured by chemiluminescense (Diasorin diagnostics) and insulin by electrochemiluminescense (Roche). Homeostatic Model Assessment-Insulin Resistance (HOMA-IR) index was calculated by the equation HOMA-IR= insulin (mU/L) x glucose x18 (mg/dl)/22.5. PT, APTT, levels of fibrinogen, factor VII, VIII, antithrombin (AT), protein C (PC), D-dimers, plasminogen (Plg), PAI-1, a2 antiplasmin (a2AP) were also evaluated in all children at the entry in the study.
Children with GHD were reassessed after 6–12 months by means of height, weight and pubertal stage. None has entered puberty. All metabolic and coagulation parameters were reevaluated after 6–12 months of GH treatment.
Statistical analysis was performed using SPSS 19. Results were expressed as mean (SE). The distribution of each variable was tested for deviation from the Gaussian distribution, using Kolmogorov-Smyrnov test. As values were not normally distributed, non-parametric tests were used. Mean values for groups were compared using Mann-Whitney test and values from the same subjects were compared using Wilcoxon paired test. Correlation between variables was evaluated using Spearman’s correlation of coefficient.
All procedures were in accordance with the ethical standards of the institutional and/or national research committee and with the 1964 Helsinki declaration and its later amendments or comparable ethical standards. Parental consent was obtained from all individual participants included in the study.
Results
Age, bone age, standard deviation scores for height (HSDS), weight and BMI (BMISDS) were recorded for both groups (GHD and control) at the start of the study. A significant difference was observed in HSDS and bone age between the two groups. Both were significantly lower in GHD children as expected (Table 1). No significant differences were observed between the two groups in measurements of BP, glucose, insulin, HOMA-IR, cholesterol and triglycerides except for IGF-I SDS levels which were significantly lower in GHD children (Table 1).
Table 1. Anthropometric and clinical data for GHD and control groups (mean, SEM)
| GHD (n=15) | Controls (n=13) | P-value | |
| Sex (M/F) | 5/10 | 5/8 | |
| Age (yrs) | 9.8 (0.4) | 9.3 (0.6) | NS |
| Bone age (yrs) | 6.9 (0.5) | 8.5 (0.6) | <0.02 |
| HSDS | -2.3 (0.3) | -0.8 (0.5) | <0.008 |
| BMISDS | 0.3 (0.1) | 0.4 (0.2) | NS |
| Systolic BP (mm Hg) | 90.2 (2.2) | 89.5 (3.0) | NS |
| Diastolic BP (mm Hg) | 59.3 (1.7) | 55.2 (2.7) | NS |
| Cholesterol (mg/dL) | 167.0 (5.5) | 171 (2.7) | 0.6 |
| Triglycerides (mg/dL) | 79.7 (3.3) | 82.1 (3.8) | 0.08 |
| Glucose (mg/dL) | 81.0 (1.4) | 82.5 (1.6) | 0.3 |
| Insulin (U/L) | 4.5 (1.0) | 4.3 (1.2) | 0.1 |
| HOMA | 0.83 (0.2) | 0.92 (0.3) | 0.2 |
| IGF-I SDS | -1.8 (0.1) | -0.8 (0.2) | <0.0001 |
Regarding coagulation-fibrinolysis evaluated parameters, all GHD and control children had all tested parameters within normal ranges at the initiation of the study. No sex differences were observed in all studied parameters. However, GHD children had significantly lower PT (12.1±0.1 vs 12.5±0.04sec, p=0.04), and AT levels (117.3± 3.1 vs 128.7± 3.2%, p=0.024) and significantly higher baseline factor VIII (122.6±6.1 vs 82.6±6.1%, p=0.001), aPAI-1 levels (2.9 ±0.1 vs 1.3±0.3U/ml, p=0.001) and a2P levels (119.1 ±1.0 vs 105.2 ±2.0%, p=0.001) than controls (Table 2). No significant differences were found in the rest of coagulation parameters between GHD and control children.
Table 2. Comparison between baseline values of coagulation/fibrinolytic parameters of GHD children and controls (mean,SE)
| GHD | Controls | P-value | Normal ranges | |
| PT (sec) | 12.1 (0.15) | 12.5 (0.13) | 0.04 | 10-14 |
| APTT (sec) | 27.3 (0.8) | 27.7 (1.6) | 0.08 | 20-39 |
| Fibrinogen (mg%) | 272.3 (10.8) | 313.2 (15.0) | 0.15 | 200-400 |
| VII (%) | 88.0 (4.5) | 77.1 (6.2) | 0.10 | 60-120 |
| VIII (%) | 122.6 (6.1) | 82.6(6.1) | 0.001 | 50-150 |
| AT(%) | 117.3 (3.1) | 128.7 (3.2) | 0.024 | 80-120 |
| PC (%) | 105.3 (3.5) | 113.8 (2.7) | 0.30 | 60-140 |
| D-dimers (μg/mL) | 0.39 (0.15) | 0.3 (0.05) | 0.73 | <0.5 |
| PL (%) | 106.9 (3.1) | 101.9 (3.1) | 0.29 | 80-120 |
| PAI-1 (U/mL) | 2.9 (0.1) | 1.3 (0.3) | 0.001 | <4 |
| a2-P (%) | 119.1 (1.0) | 105.2 (2.0) | 0.001 | 80-120 |
After a mean interval of 9.3 (0.4) months of rhGH replacement therapy, a significant improvement was observed in HSDS (1.7 (0.5) vs -2.3 (0.3), p=0.0001) and IGF-I SDS (-0.8 (0.2) vs -1.8 (0.1), p=0.0001) levels of GHD children Table 3). No significant changes were found in BP, cholesterol, triglyceride and glucose measurements. A significant increase in insulin levels (7.0±1.2 vs 4.5± 1.0, p=0.0009) and consequently in HOMA-IR (1.35±0.4 vs 0.83±0.2, p=0.001) was however observed after GH treatment (Table 3).
Table 3. Pre- and post- treatment data on antrhopmetric, metabolic parameters and coagulation/fibrinolytic parameters of GHD children (mean,SE)
| GHD before | GHD after | P-value | |
| HSDS | -2.3 (0.3) | -1.7 (0.5) | 0.0001 |
| BMISDS | 0.3 (0.1) | 0.2 (0.2) | 0.1 |
| Systolic BP(mm Hg) | 90.2 (2.2) | 90.5 (3.0) | 0.9 |
| Diastolic BP(mm Hg) | 59.3 (1.7) | 54.2 (1.7) | 0.5 |
| Chol (mg/dl) | 167.0 (5.5) | 169.2 (2.7) | 0.6 |
| TG (mg/dl) | 79.7 (3.3) | 75.1 (3.8) | 0.2 |
| Glucose(mg/dL) | 81.0 (1.4) | 83.5 (1.6) | 0.3 |
| Insulin (μU/mL) | 4.5 (1.0) | 7.0 (1.2) | 0.0009 |
| HOMA-IR | 0.83 (0.2) | 1.35 (0.4) | 0.001 |
| IGF-I SDS | -1.8 (0.1) | -0.8 (0.2) | 0.0001 |
| PT (sec) | 12.1 (0.15) | 12.5 (0.23) | 0.034 |
| aPTT (sec) | 27.5 (0.6) | 28.2 (0.8) | 0.25 |
| Fibrinogen (mg%) | 272.3 (10.8) | 268.1 (10.3) | 0.77 |
| VII (%) | 88.0 (4.5) | 92.0 (7.6) | 0.68 |
| VIII (%) | 122.6 (6.0) | 133.3 (12.1) | 0.08 |
| AT (%) | 117.3 (3.1) | 123.2 (2.6) | 0.052 |
| PC (%) | 105.3 (3.5) | 106.9 (4.0) | 0.23 |
| D-dimers (μg/mL) | 0.48 (0.2) | 0.3 (0.05) | 0.75 |
| PL (%) | 106.9 (3.1) | 111.1(2.0) | 0.23 |
| PAI-1 (U/mL) | 2.9 (0.1) | 2.3 (0.3) | 0.001 |
| a2-P (%) | 119.1 (1.0) | 120.0 (0.1) | 0.07 |
PT was significantly increased (12.5±0.23 vs 12.1±0.15sec, p=0.034), reaching control levels. AT levels had undergone a statistically significant increase (123.2 ±2.6 vs 117.3±3.1%, p=0.052) and aPAI-1 levels a statistically significant decrease (2.3±0.3 vs 2.9±0.1U/ml, p=0.001), approaching levels recorded for controls (Table 3). Factor VIII and a2P levels were not significantly modified, nor any other significant alterations in coagulation parameters were observed after GH treatment.
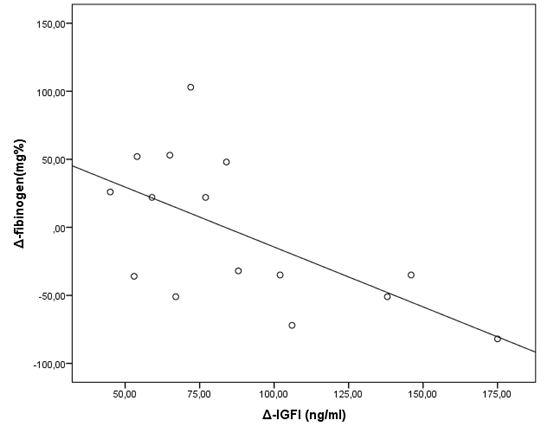
Changes (Δ) in all these variables were evaluated as the difference between posttreatment and baseline values. No significant correlations were observed between changes (Δ) in PT, AT, aPAI-1, a2P levels and changes in metabolic parameters such as insulin/HOMA-IR, lipid levels nor changes in IGF-I levels during GH treatment (Table 4). The only simple linear correlation reaching levels of statistical significance was a negative correlation between variances in fibrinogen levels and IGF-I levels (r=-0.56, p=0.031) (Figure 1).
Table 4. Simple linear correlation between variations in PT, PAI-1, a2P, fibrinogen levels and variations in insulin levels/HOMA index, systolic/diastolic BP, cholesterol, TG, IGF-I.
| Δ Cholesterol | Δ TG | Δ systolic BP | Δ diastolic BP | Δ-insulin | Δ-HOMA-IR | Δ IGF-I SDS | |
| Δ PT | r=0.14 | r=0.05 | r=-0.22 | r=0.08 | r=0.08 | r=0.08 | r=0.17 |
| Δ PAI-1 | r=0.05 | r=0.21 | r=0.13 | r=0.08 | r=-0.22 | r=-0.18 | r=-0.19 |
| Δ-a2P | r=0.12 | r=0.09 | r=0.14 | r=0.21 | r=0.11 | r=-0.18 | r=-0.09 |
| Δ-ΑΤ | r=0.08 | r=0.08 | r=0.07 | r=0.1 | r=-0.02 | r=0.14 | r=0.2 |
| Δ fibrinogen | r=0.09 | r=0.08 | r=0.08 | r=0.18 | r=-0.21 | r=-0.14 | r=-0.42, p=0.05 |
| Δ IGF-1 SDS | r=0.15 | r=-0.13 | r=0.15 | r=0.00 | r =0.24 | r=0.19 |
Figure 1. Changes in fibrinogen levels were negatively associated with changes in IGF-I levels (r=-0.56, p=0.031)
Discussion
The main results of the study are that a subclinical degree of impairment in the coagulation-fibrinolysis system of subjects with GHD exists even from childhood, and GH therapy seems to reverse these subclinical changes.
PT and AT were statistically significantly decreased and VIII, aPAI-1 and a2P were statistically significantly increased in GHD children compared to controls. PT is a basic coagulation test that evaluates time necessary to clot in vitro, which assesses the extrinsic and common pathways of coagulation. Hence reduction of PT reflects increased thrombin generation. A shortened clotting time has been associated with an increased risk of thrombosis, recurrent thrombosis and recurrent miscarriages. Lower PT compared to healthy controls has been reported in GH deficient adults 20 and GH replacement therapy has been shown to increase PT and APTT in GHD adults 16. The same subclinical change in PT and reversal after GH treatment was noted in GHD children for the first time in our study.
Factor VIII was also found increased in GHD children compared to controls in our study. However, APTT was not affected in GHD children compared to controls. In GHD adults an increase in vWF, the carrier and stabilizer of VIII has been reported.11,14 As vWF is regarded as a marker of endothelial cell activation, the authors attributed its increase in significant endothelial dysfunction in hypopituitarism and suggested that GH deficiency may play a role in this abnormality.11
Antithrombin, previously known as AT III, is a natural anticoagulant, the main inhibitor of thrombin. It is a serine protease inhibitor, which binds and inactivates thrombin, factor IXa, Xa, XIa and XIIa. Antithrombin levels were within normal ranges in GHD children, although significantly lower compared to controls, suggesting decreased inhibition of thrombin generation. GH replacement therapy led to a significant increase in antithrombin levels, indicating a possible role of GH in this subclinical alteration. In agreement with this hypothesis, higher antithrombin levels have been reported in patients with active acromegaly.21 The authors suggested as a possible explanation that the increase in AT III might be a protective mechanism and/or compensatory response versus hypercoagulable state (e.g., enhanced PAI-1 secretion) seen in acromegaly.
Moreover, aPAI-1 and a2P levels which are both fibrinolysis inhibitors were significantly higher in GHD children compared to controls. The level of significance was high enough to overcome the possible biological variability in the measurements of these fibrinolytic parameters. 22 Repeat measurements on control children of coagulation and fibrinolytic parameters during follow-up, to test their variability, were not performed, and this is a limitation of our study. Plasminogen activator inhibitor-1 (PAI-1) is present in plasma in trace concentrations and is secreted by multiple cell types, including vascular endothelium and smooth muscle cells. It is the primary inhibitor of both tissue-type plasminogen activator (t-PA) and urinary-type plasminogen activator (u-PA). By this action, PAI-1 suppresses plasmin formation and fibrinolysis. Hence, increase in PAI-1 levels reflects decreased fibrinolytic activity. Reduced fibrinolytic activity, due to excessive expression of fibrinolysis inhibitors, can predispose the patient to thrombosis; hence increased PAI-1 levels have been associated with increased risk of thrombotic complications.
Increased PAI-1 levels have been reported in GHD adults.13,14 GH replacement therapy in hypopituitary patients led to a reversal of PAI-1 levels to normal.15,23 In agreement with findings of another study in GHD children,17 PAI-1 levels were found increased compared to control children and short-term GH therapy produced a significant decline, approaching the levels of healthy controls.
It is noteworthy that insulin stimulates PAI-1 synthesis and secretion by vascular endothelial cells. Therefore, increased PAI-1 levels have been reported in obesity and type II diabetes. In order to exclude possible influences of insulin resistance to PAI-1 levels, we selected only prepubertal, non-obese with no intrauterine growth retardation (IUGR) children to participate in this study.
For the same reason and in order to evaluate the possible influence of biochemical markers on the coagulation-fibrinolysis parameters, we evaluated changes of metabolic parameters in GHD children during GH therapy. Short term GH therapy produced an increase in insulin levels and insulin resistance. However, these changes were not correlated with changes in PAI-1 levels nor with changes in any of the evaluated parameters of coagulation system.
Alpha-2-antiplasmin (alpha-2-plasmin inhibitor) is produced in the liver and is abundant in plasma, where it is the major inhibitor of plasmin, a serine protease that degrades fibrin. Plasmin released into the circulation is rapidly inactivated by alpha-2-antiplasmin, thus increased levels of a2P also reflect decreased fibrinolytic activity. a2P levels were also found significantly increased in GHD children compared to controls. Short term GH replacement did not affect its levels.
Fibrinogen levels which have been reported increased in GHD adults 12-15 were not significantly different in GHD children from levels of healthy controls. A negative correlation between changes in fibrinogen levels and IGF-1 levels after rhGH treatment was noticed. As the increase of IGF-I levels reflects the action of GH, this correlation could suggest a possible favourable effect of GH therapy to fibrinogen levels as well.
On the other hand, lack of a correlation of IGF-I changes with changes in coagulation or metabolic parameters except with delta fibrinogen does not preclude a direct GH effect (presumably mediated through IGF-I) based on the fact that multiple factors can concomitantly affect IGF-I levels, e.g., GH dose, suboptimal nutrition, etc.
The number of patients was limited and this is the greatest limitation of our study. Additionally, it has to be noted that the dose of rhGH used for the treatment of GHD children was relatively low compared to the proposed one.24 A higher dose should produce higher IGF-I SDS increases that could lead to significant changes in other coagulation and fibrinolysis parameters and perhaps correlations with changes in their levels.
Conclusions
Overall, data from this study suggest that subclinical changes in coagulation-fibrinolysis system are encountered even before puberty. These changes are mostly similar with those seen in GHD adults, suggesting that alterations in coagulation/fibrinolysis system may start even from an early age, reinforcing the already known data on a mild prothrombotic state and increased cardiovascular risk of these patients. GH replacement seems to exert a beneficial effect on the blood coagulation parameters. Have these alterations any clinical significance? The effect of GH on these parameters is a direct effect of GH itself, or it may be secondary to changes in metabolic parameters? Long-term prospective studies including larger number of GHD children are needed to confirm the above findings and give answer to the above questions.
Disclose statement
The authors declare that they have no conflict of interest.
References
- Buelow B, Hagmar L, Mikoczy Z, Nordstrom CH, & Erfurth EM. Increased cerebral mortality in patients with hypopituitarism. Clin Endocrinol. 1997;46: 75–81.
- Sacca L. GH deficiency and vascular disease: in search of linking mechanism. Eur J Endocrinol. 1997;136: 148–149.
- RoseÂn, T & Bengtsson BA. Premature mortality due to cardiovascular disease in hypopituitarism. Lancet. 1990;36: 285–288.
- Tomlinson JW, Holden N, Hills RK, et al. Association between premature mortality and hypopituitarism. West Midlands Prospective Hypopituitary Study Group. Lancet. 2001;357: 425–431.
- Al-Shoumer KA, Cox KH, Hughes CL, Richmond W, & Johnston DG. Fasting and postprandial lipid abnormalities in hypopituitary women receiving conventional replacement therapy. J Clin Endocrinol Metabol. 1997;82: 2653–2659.
- Lanes R, Gunczler P, Lopez E, et al. Cardiac mass and function, carotid artery intima-media thickness adipoprotein levels in growth hormone deficient adolescents. J Clin Endocrinol Metab. 2001;86: 1061–1065.
- Hew FL, Koschmann M, Christopher M, et al. Insulin resistance in growth hormone-deficient adults: defects in glucose utilization and glycogen synthase activity. J Clin Endocrinol Metabol. 1996;81: 555–564.
- Evans LM, Davies JS, Goodfellow J, Rees JA, & Scanlon MF. Endothelial dysfunction in hypopituitary adults with growth hormone deficiency. Clin Endocrinol. 1999;50: 457–464.
- Cittadini A, Cuocolo A, Merola B, et al. Impaired cardiac performance in GH-deficient adults and its improvement after GH replacement. Am J Physiol. 1994;267: E219–E225.
- Colao A, Di Somma C, Marzullo P, Lombardi G. Growth hormone and the heart. Clin Endocrinol (Oxf). 2001;54: 137–154.
- Elhadd TA, Abdu TA, Oxtoby J, et al. Biochemical and biophysical markers of endothelial dysfunction in adults with hypopituitarism and severe GH deficiency. J Clin Endocrinol Metabol. 2001;86: 223–4232.
- Sartorio A, Cattaneo M, Bucciarelli P, et al. Alterations of haemostatic and fibrinolytic markers in adult patients with growth hormone deficiency and with acromegaly. Exp Clin Endocrinol Diab. 2000;108: 486–492.
- Johansson JO, Landin K, Tengborn L, Rose´n T & Bengtsson BA. High fibrinogen and plasminogen activator inhibitor activity in growth hormone-deficient adults. Arterioscler Thromb Vasc Biol. 1994;14: 434–437.
- Kvasnicka J, Marek J, Kvasnicka T, et al. Increase of adhesion molecules, fibrinogen, type-1plasminogen activator inhibitor and orosomucoid in growth hormone (GH) deficient adults and their modulation by recombinant human GH replacement. Clin Endocrinol. 2000;52: 543–548.
- Johansson JO, Landin K, Johannsson G, Tengborn L & Bengtsson BA: Long-term treatment with growth hormone decreases plasminogen activator inhibitor-1 and tissue plasminogen activator in growth hormone-deficient adults. Thromb Haemost. 1996;76: 422–428.
- Miljic D, Miljic P, Doknic M, et al. Changes in prothrombin and activated partial thromboplastin time during replacement therapy with human recombinant growth hormone in growth hormone deficient adults. Hormones 2006;5: 187–191.
- Cañete R, Valle M, Martos R, et al. Short-term effects of GH treatment on coagulation, fibrinolysis, inflammation biomarkers, and insulin resistance status in prepubertal children with GH deficiency. Eur J Endocrinol. 2012;167: 255–260.
- Lanes R, Paoli M, Carrillo E, Villaroel O, Palacios A. Cardiovascular risk of young growth hormone deficient adolescents. Differences in growth hormone treated and untreated patients. Horm Res 2003;60: 291–296.
- Colao A, di Somma C, Salermo M, et al. The cardiovascular risk of GH-deficient adolescents: J Clin Endocrinol Metabol. 2002;87: 3650–3655.
- Diniz RD, Souza RM, Salvatori R, et al. Liver status in congenital, untreated, isolated GH deficiency. Endocr Connect. 2014;3: 132–137.
- Erem C. Coagulation and fibrinolysis in thyroid dysfunction. Endocrine. 2009;36: 110–118.
- Banfi G, & Del Fabbro M. Biological Variation in Tests of Hemostasis. Semin Thromb Hemost. 2009;35: 120–126.
- Murray RD, Wieringa G, Lawrance JA, Adams JE, Shalet SM. Partial growth hormone deficiency is associated with an adverse cardiovascular risk profile and increased carotid intima-medial thickness. Clin Endocrinol. 2010;73: 508–515.
- Grimberg A, DiVall S, Polychronakos C, et al. On behalf of the Drug and Therapeutics Committee and Ethics Committee of the Pediatric Endocrine Society. Guidelines for Growth Hormone and Insulin-Like Growth Factor-I Treatment in Children and Adolescents: Growth Hormone Deficiency, Idiopathic Short Stature, and Primary Insulin-Like Growth Factor-I Deficiency. Horm Res Paediatr. 2016;86: 361–397.